Arctic is one of the highest-grade copper deposits known in the world with an estimated average grade of about 5% copper equivalent.
The Arctic deposit (“Arctic”), is a polymetallic volcanogenic massive sulphide deposit located approximately 470 kilometers northwest of the City of Fairbanks, Alaska. Arctic is at feasibility stage and current activities are focused on advancing permitting.
| Location | Alaska, USA |
| Deposit Type | Volcanogenic Massive Sulphide |
| Host | Arctic Sequence, Ambler Belt |
| Age | Devonian |
| Economic Elements | Copper, Zinc, Lead, Gold, Silver |
We announced the results of the Arctic Feasibility Study (“FS”) on February 14, 2023 and filed the technical report titled “Arctic NI 43-101 Technical Report on Feasibility Study” on February 14, 2023.
The FS for the Arctic Project describes the potential technical and economic viability of establishing a conventional open-pit copper-zinc-lead-silver-gold mine-and-mill complex for a 10,000-tonne-per-day operation. The base case scenario utilizes long-term metal prices of $3.65/lb for copper, $1.15/lb for zinc, $1.00/lb for lead, $1,650/oz for gold and $21.00/oz for silver in its economic analysis. The FS was prepared on a 100% ownership basis and all amounts are in US dollars.
2023 Feasibility Study
- Pre-tax Net Present Value (“NPV”)8% of $1.5 billion and an Internal Rate of Return (“IRR”) of 25.8%.
- After-tax NPV8% of $1.1 billion and after-tax IRR of 22.8%.
- At February 2023 spot metals prices of $4.02/lb copper, $1.39/lb zinc, $0.95/lb lead, $1,853/oz gold and $22/oz silver, the pre-tax NPV8% is $2.1 billion and IRR is 31.5%, and after-tax NPV8% is $1.6 billion and IRR is 27.8%.
- The 2023 FS is based on a 10,000-tonne-per-day open-pit mining rate with a conventional milling and flotation process that results in the production of separate copper, zinc and lead concentrates.
- Based on the feasibility-level metallurgical work on the sulphide mineralization, the average recoveries are projected to be 92.1% for copper, 88.5% for zinc and 61.3% for lead, in their respective concentrates. Life-of-mine strip ratio (waste:ore) is approximately 7.3 to 1.
- The 2023 FS forecasts an average annual payable production to be 149 million pounds of copper, 173 million pounds of zinc, 26 million pounds of lead, 32,538 ounces of gold and 2.8 million ounces of silver.
- Total life-of-mine 13-year production is projected at 1.9 billion pounds of copper, 2.2 billion pounds of zinc, 335 million pounds of lead, 423,000 ounces of gold and 36 million ounces of silver.
- Initial capital expenditure is $1,176.8 million and sustaining capital is $114.4 million for total estimated capital expenditures of $1,291.2 million.
- Closure and reclamation costs are estimated at $428.4 million.
- Estimated pre-tax and after-tax payback of initial capital are 2.9 years and 3.1 years respectively.
- Estimated cash costs are $0.72/lb of payable copper (cash costs include on-site mining and processing costs, road tolls and maintenance, transport, royalties, and is net of by-product credits).
- Total “all-in” cash costs (initial/sustaining capital, operating, closure costs and is net of by-product metal credits) are estimated at $1.61/lb of payable copper.
- Mineral Resources are not Mineral Reserves and do not have demonstrated economic viability. There is no certainty that all or any part of the Mineral Resources will be converted to Mineral Reserves.
Resource Estimate for Arctic Project
| Resource | Tonnage | Average Grade | Contained Metal Content | ||||||||
|---|---|---|---|---|---|---|---|---|---|---|---|
| Cu | Pb | Zn | Au | Ag | Cu | Pb | Zn | Au | Ag | ||
| Confidence Category | (Mt) | (%) | (%) | (%) | (g/t) | (g/t) | (Mlb) | (Mlb) | (Mlb) | (koz) | (Moz) |
| Indicated | 35.7 | 2.98 | 0.79 | 4.09 | 0.59 | 45.2 | 2,347 | 621 | 3,216 | 675 | 52 |
| Indicated – 50% Attributable Interest | 17.85 | 2.98 | 0.79 | 4.09 | 0.59 | 45.2 | 1,173.5 | 310.5 | 1,608 | 337.5 | 26 |
| Inferred | 4.5 | 1.92 | 0.70 | 2.93 | 0.43 | 35.6 | 189 | 69 | 288 | 62 | 5 |
| Inferred – 50% Attributable Interest | 2.25 | 1.92 | 0.70 | 2.93 | 0.43 | 35.6 | 94.5 | 34.5 | 144 | 31 | 2.5 |
- Mineral Resources were reported in the S-K 1300 Arctic Report effective as of November 30, 2022 and the NI 43-101 Arctic Report with an effective date of November 15, 2022. A Qualified Person and an employee of Trilogy Metals, has approved the mineral resources included in this Annual Report on Form 10-K as of November 30, 2025 and reviewed the resources and material assumptions in the S-K 1300 Arctic Report and confirmed that the resources and material assumptions remain current as of November 30, 2025.
- Mineral Resources in the S-K 1300 Arctic Report were prepared in accordance with the standards and definitions of S-K 1300. Mineral Resources in the NI 43-101 Arctic Report were prepared in accordance with the CIM Mineral Resources and Mineral Reserves Definitions Standards.
- Mineral Resources stated are contained within a conceptual pit shell developed using metal prices of $3.00/lb Cu, $0.90/lb Pb, $1.00/lb Zn, $1300/oz Au and $18/oz Ag and metallurgical recoveries of 92% Cu, 77% Pb, 88% Zn, 63% Au and 56% Ag and operating costs of $3/t mining and $35/t process and G&A. The assumed average pit slope angle is 43°.
- The cut-off grade is 0.5% copper equivalent. CuEq = (Cu%x0.92) + (Zn%x0.290) + (Pb%x0.231) + (Au g/tx0.398) + (Ag g/tx0.005).
- As a result of flattening the north end of the reserve pit to stabilize the pit wall due to the presence of talc, a portion of the reserve pit extended beyond the resource constraining pit shell. Approximately 568kt of 1.72% Cu, 0.77% Pb, 0.23 g/t Au and 21.3 g/t Ag in the Indicated category, and approximately 319 kt of 2.01% Cu, 0.87% Pb, 2.53% Zn, 0.50 g/t Au and 37.5 g/t Ag in the Inferred category were added to the Mineral Resource tabulation.
- The Mineral Resource estimate is reported inclusive of those Mineral Resources that were converted to Mineral Reserves.
- Trilogy Metals’ attributable interest is 50% of the amounts in the table.
- Figures may not sum due to rounding.
Reserve Estimate for Arctic Project
| Classification | Tonnage | Average Grade | ||||
|---|---|---|---|---|---|---|
| (Mt) | Cu (%) | Pb (%) | Zn (%) | Au (g/t) | Ag (g/t) | |
| Probable Mineral Reserves – 50% Attributable Interest | 23.35 | 2.11 | 0.56 | 2.9 | 0.42 | 31.8 |
- A Qualified Person and an employee of Trilogy Metals, has approved the mineral reserves and mineral resources included in this Annual Report on Form 10-K as of November 30, 2025 and reviewed the reserves and the material assumptions in the S-K 1300 Arctic Report and confirmed that the reserves and material assumptions remain current as of November 30, 2025.
- Mineral Reserves were estimated assuming open pit mining methods and include a combination of internal and contact dilution. Total dilution is expected to be between 30% and 40%. Pit slopes vary by sector and range from 26° to 56°. A marginal NSR cut-off of $38.8 /t is used.
- Mineral Reserves are based on prices of $3.46/lb Cu, $0.91/lb Pb, $1.12/lb Zn, $1,615/oz Au, and $21.17/oz Ag. The long-term metal price forecast used a combination of information derived from 22 financial institutions, from pricing used in technical reports filed with Canadian regulatory authorities over the previous 12-month period prior to the publication of the S-K 1300 Arctic report, from pricing reported by major mining companies in public filings such as annual reports in the previous 12-month period prior to the publication of the S-K 1300 Arctic report, spot pricing, and three-year trailing average pricing.
- Variable process recoveries averaging 92% Cu in Cu concentrate, 62% Pb in Pb concentrate, 88% Zn in Zn concentrate, 47% Au in Cu concentrate, 33% Ag in Cu concentrate, 26% Au in Pb concentrate and 49% Ag in Pb concentrate.
- Mineral Reserves are based on mining cost of $2.52/t incremented at $0.02/t/5m and $0.012/t/5m below and above 790 m elevation, respectively.
- Costs applied to processed material following: process operating cost of $18.31/t, G&A of $5.83/t, sustaining capital cost of $2.37/t, closure cost of $4.27/t, road toll cost of $8.04/t.
- Strip ratio (waste:ore) is 7.3:1.
- Selling terms following: payables of 96.5% of Cu, 95% of Pb and 85% of Zn, treatment costs of $80/t Cu concentrate, $160/t Pb concentrate and $215/t Zn concentrate; refining costs of $0.08/lb Cu in Cu concentrate, and$10/oz Au, $1.25/oz Ag in Pb concentrate; and transport cost $270.98/t concentrate.
- Fixed royalty percentage of 1% NSR.
- Trilogy Metals’ 50% attributable interest is stated in the table.
- The point of reference for the Mineral Reserves is defined at the point where the ore is delivered to the processing plant.
- The metal prices and costs were fixed over the 13-year mine life.
Geology and Mineralization
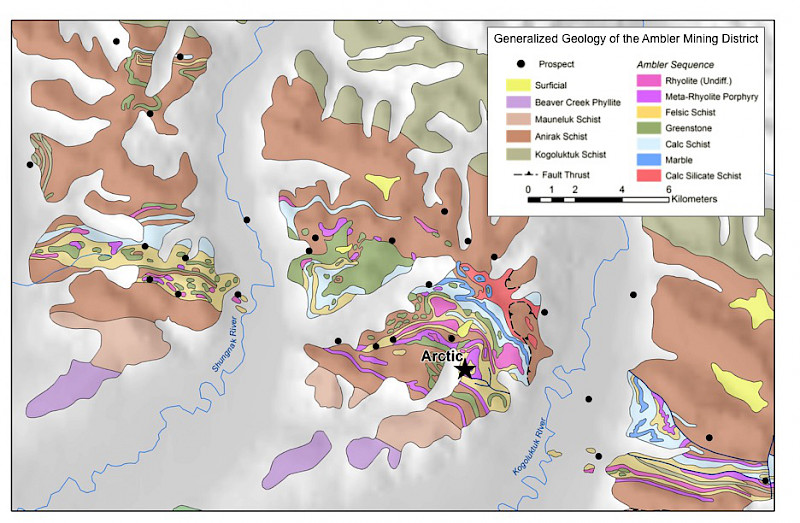
The Arctic deposit is a polymetallic volcanogenic massive sulphide (“VMS”) style deposit hosted in the Ambler Belt, a group of Middle Devonian to Early Mississippian, metamorphosed, bimodal volcanic and volcaniclastic rocks with interbedded metasediments. VMS-style mineralization occurs along the 110-kilometer strike length of the belt.
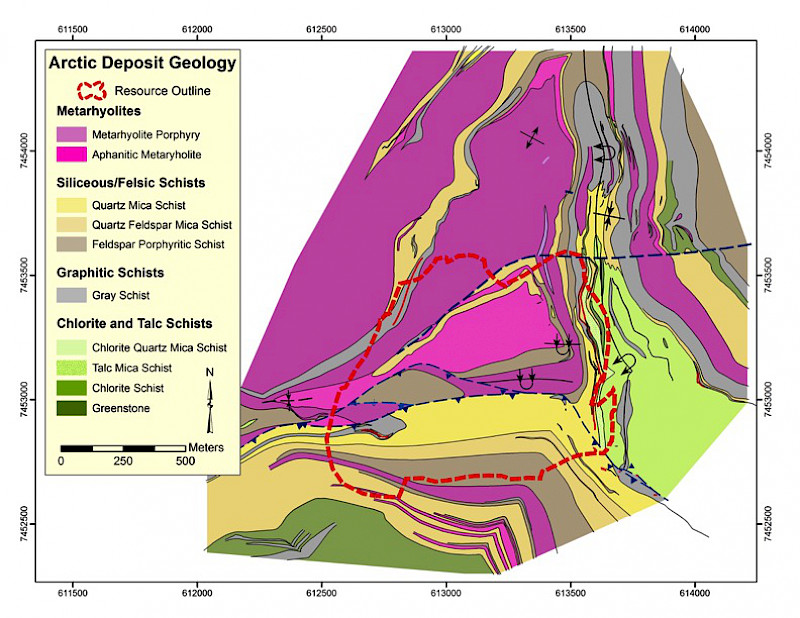
Mineralization at Arctic forms semi-massive to massive sulphide beds composed of coarse-grained sulphides consisting mainly of chalcopyrite, sphalerite, galena, tetrahedrite, arsenopyrite, pyrite and pyrrhotite within graphitic and quartz mica (+/- chlorite) schists. The sulphide beds average 4 meters in thickness but vary from less than 1 meter up to as much as 25 meters in thickness. The bulk of the mineralization is within an area of roughly 1 km2 with mineralization extending 250 meters below the surface.
Maps


